OUTSIDE CANADA · DEMOGRAPHICS · CANADIAN CONTEXT
Global minority, local majority: what a TikTok population chart can—and cannot—show
Published 19 September 2026 · Media-literacy source-check
Verdict: A global numerical minority can also be a national majority. The video’s broad observation about European-descended populations does not expose a contradiction in local minority terminology. Its chart shows geographic population totals, not a worldwide racial census or evidence about anyone’s citizenship.
Start with the denominator
A TikTok posted by @willydisavowed argues that people described as white or European-descended are a minority worldwide, so calling other groups minorities in Western countries is misleading. The captured upload metadata dates the approximately 113-second clip to August 11, 2026. That establishes an upload date, not when the commentary was recorded.
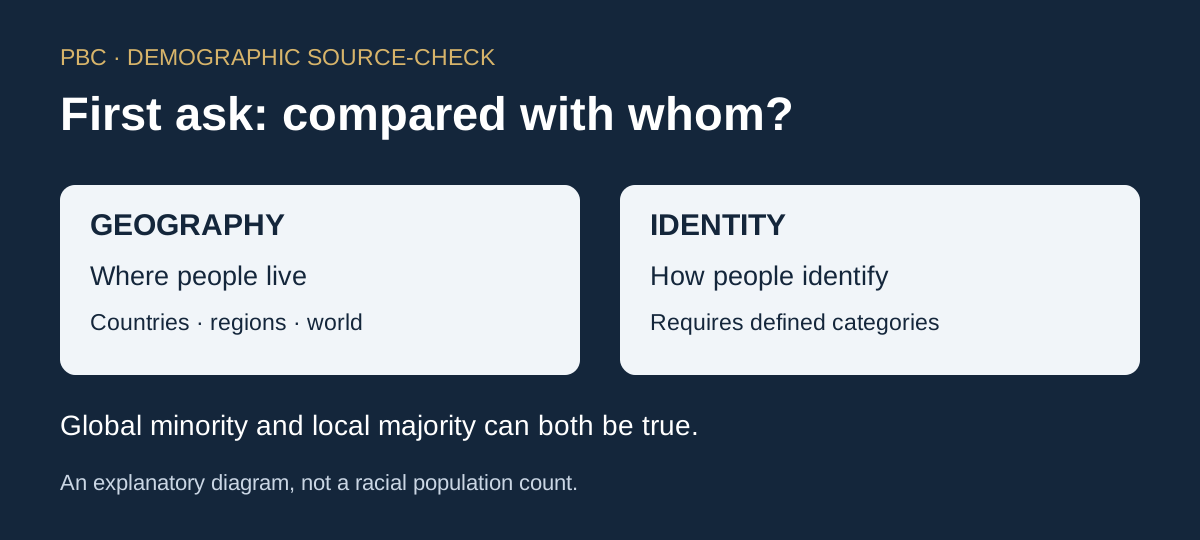
The broad global observation is reasonable under ordinary usage: European-descended people are not a majority of humanity. But the conclusion changes the denominator halfway through. “Minority in the world” and “minority in Canada” compare a group with different populations. Both descriptions can be true without fraud, special treatment or statistical sleight of hand.
A person’s ancestral country having a large population does not make their group a majority wherever they live. Nor does numerical minority status, by itself, prove social disadvantage. Population share, experiences of discrimination and legal categories are related subjects, not interchangeable measurements.
The coloured shapes are not racial categories
The displayed graphic is a country-population treemap. The area of a block represents population, not physical territory. Colours group geographic populations; they cannot establish that everyone in a country or continent shares a race or ancestry.
The clip uses Visual Capitalist’s September 27, 2022 world-population graphic, credited to UN data via Worldometer. A comparison of matching visual features confirms the graphic, not endorsement of the narration by its publisher. The accompanying article dates its figures to that day and describes Europe at roughly 750 million people. A single snapshot cannot establish the caption’s claim about demographic status throughout history.
The age of those numbers matters. The UN’s World Population Prospects 2024 release put world population at 8.2 billion in 2024; that is a dated estimate, not an exact September 2026 count. A 2023 UN brief projected India would surpass mainland China that April. Recycling an older graphic as “currently” obscures these changes.
Five categories that should stay separate
Geography concerns residence or location. Ancestry concerns family origins. Race concerns socially defined population categories that differ between societies. Citizenship concerns legal membership in a country. Immigration status concerns migration and legal admission histories. None can simply substitute for another.
The UN Statistics Division’s guidance on ethnicity says national categories and definitions vary widely and no internationally accepted criteria are possible. UN country totals therefore do not provide a harmonized global count of white people. This review supplies no exact global racial percentage.
Mixed ancestry also requires a stated classification method. Excluding mixed-ancestry people by assertion is the speaker’s rule, not something established by the treemap. Statistics Canada’s 2021 Census diversity release discusses people reporting White alongside another racialized group. Real responses do not fit the video’s all-or-nothing treatment.
What the Canadian evidence actually says
Statistics Canada’s Changing demographics of racialized people in Canada reports that racialized people represented 26.5% in the 2021 Census. This is historical census evidence, not a present-day headcount. The category follows a specific statistical definition; its remainder must not be relabelled “White.” Indigenous peoples are excluded from the employment-equity visible-minority definition, and population-group responses are not the same variable.
Race also does not mean immigrant. Statistics Canada reports that three in ten racialized people were Canadian-born in 2021. People of different racial identities can be Canadian-born citizens or immigrants. Ancestry alone tells us neither their birthplace nor their legal status.
There is a further timing limit: Statistics Canada’s September 2026 announcement schedules the first 2026 Census results for February 10, 2027. Calling these 2021 figures “2026 census results” would be wrong.
Claim-by-claim
| Claim or inference | Finding |
|---|---|
| European-descended people are a global minority. | Broadly reasonable; no harmonized global percentage established here. |
| That makes local minority terminology false. | Incorrect: global and national reference populations differ. |
| Country colours identify racial populations. | Unsupported: geographic totals do not measure ancestry or race. |
| The chart establishes immigration-driven national changes. | Not established: it supplies neither migration flows nor a national time series. |
| Exact inventories of European countries, ethnic groups and languages settle the argument. | Unverified and definition-dependent; cultural diversity does not resolve the denominator problem. |
Local majorities really can vary
The same Statistics Canada release reports that close to 70% of Canada’s population reported being White in 2021, but the corresponding shares were 42.0% in the Vancouver census metropolitan area and 40.7% in the Toronto census metropolitan area. These are dated metropolitan figures, not 2026 city-proper counts. National and local patterns can genuinely differ. That supports specifying the place and category—not inferring coercion or anyone’s right to belong.
Debate policy using evidence that measures policy
Immigration levels, housing supply, public-service capacity and integration are legitimate subjects for democratic debate. Assessing them requires specified countries, periods and measures—not converting a global population chart into racial categories.
The clip’s exclusionary conclusions about belonging are political rhetoric, not statistical findings. A chart cannot determine who is entitled to citizenship, whose ancestry counts, or whether residents have another country to which they could move. Recognizing the real demographic observation does not require accepting those conclusions.
Source package
Read the curated source note, claim table, short timestamped paraphrases and sanitized metadata. Full video, full transcript, comments and private captures are not republished. The original post is linked for provenance, not endorsement.